At Reaves, we believe one of the clearest signals of a company’s strength and durability is one of the easiest to read: dividend growth. It’s by no means the only way to gauge a company, but a management team’s willingness to grow the dividend says a lot about its confidence in the ability to grow future cash flow.
Dividend growth is also an important source of protection if we enter a period of rising inflation. Unlike bonds, which typically pay a fixed rate of income, stocks that are regularly able to increase quarterly dividend payments provide a powerful compounding effect for a portfolio. A growing stream of dividend income in a portfolio can help to reduce or eliminate any negative impacts from higher inflation.
To get a sense of the durability of the companies in our portfolio relative to the rest of the market, we periodically show their dividend growth relative to other companies in the sector in which they operate.
In the tables below, we have sorted the companies in Reaves’ LTV Wrap Composite1 by sector2, showing their dividend growth for the annual period ending June 30, and comparing it to the average dividend growth rate of their respective sector within the S&P 500 Index3.
Through the 12-month period, 17 of the 19 dividend-paying stocks in our portfolio raised their dividend, and two others held their dividend at the same rate as a year ago. In aggregate, our holdings’ dividend growth exceeded the sector average for each sector in which we invest.
We believe these companies’ ability to grow dividends in excess of the broader sector speaks to their strength and aligns with our investment objective to generate both capital appreciation and income growth.
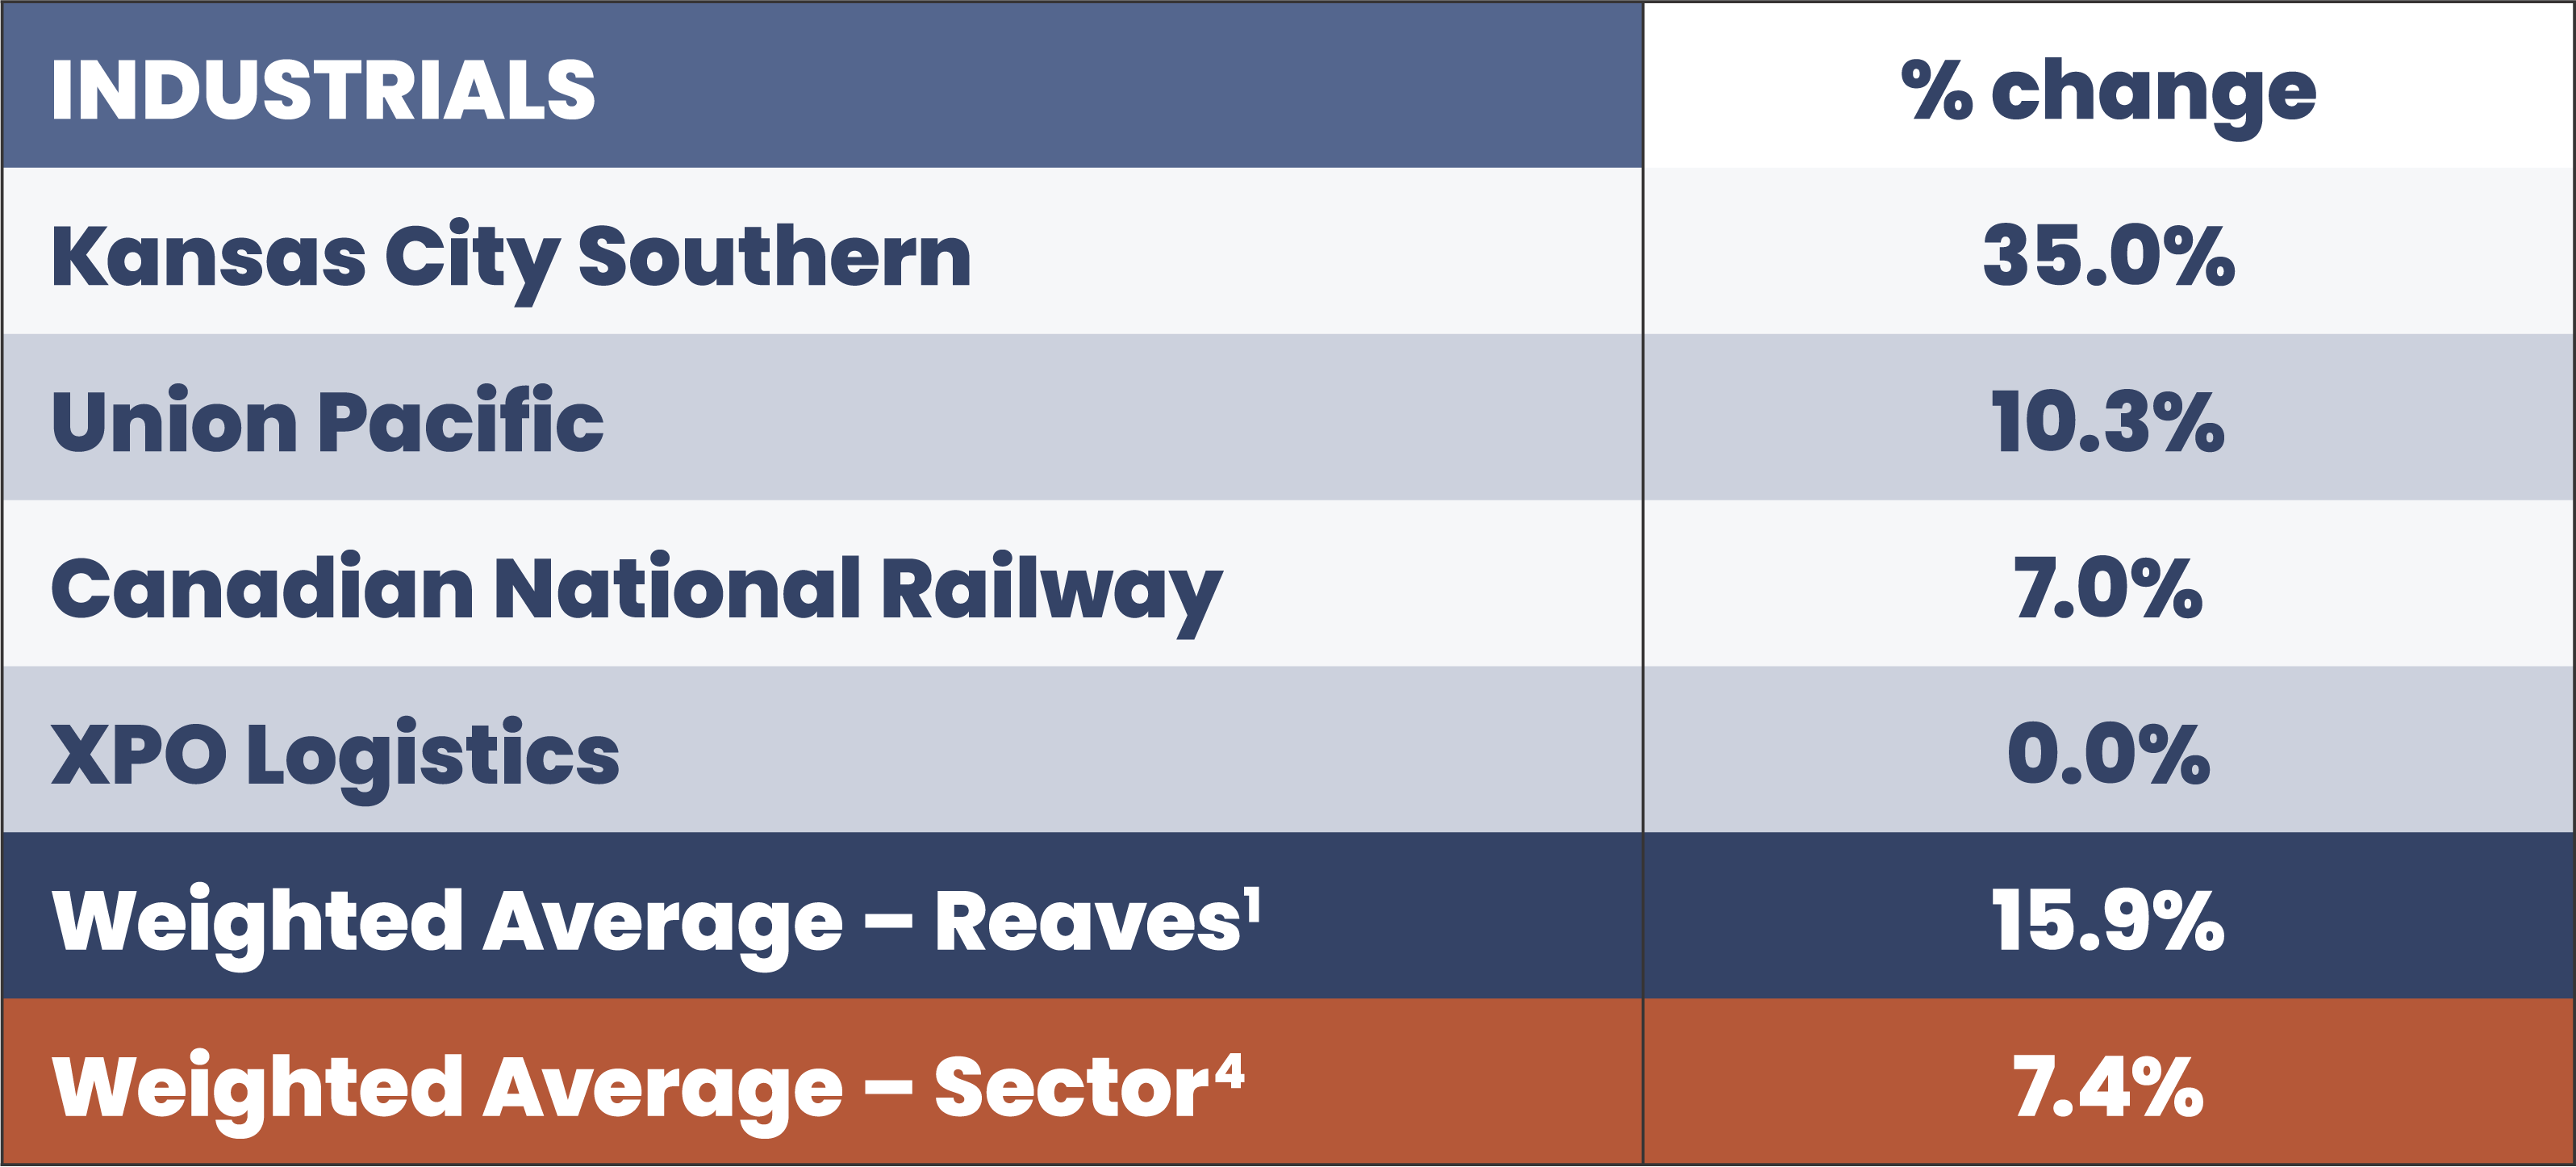
Industrials
The table below shows the annual dividend increase for each Industrial stock owned as of June 30, 2021 in a composite of wrap portfolios1 managed with the Reaves Long Term Value Strategy.
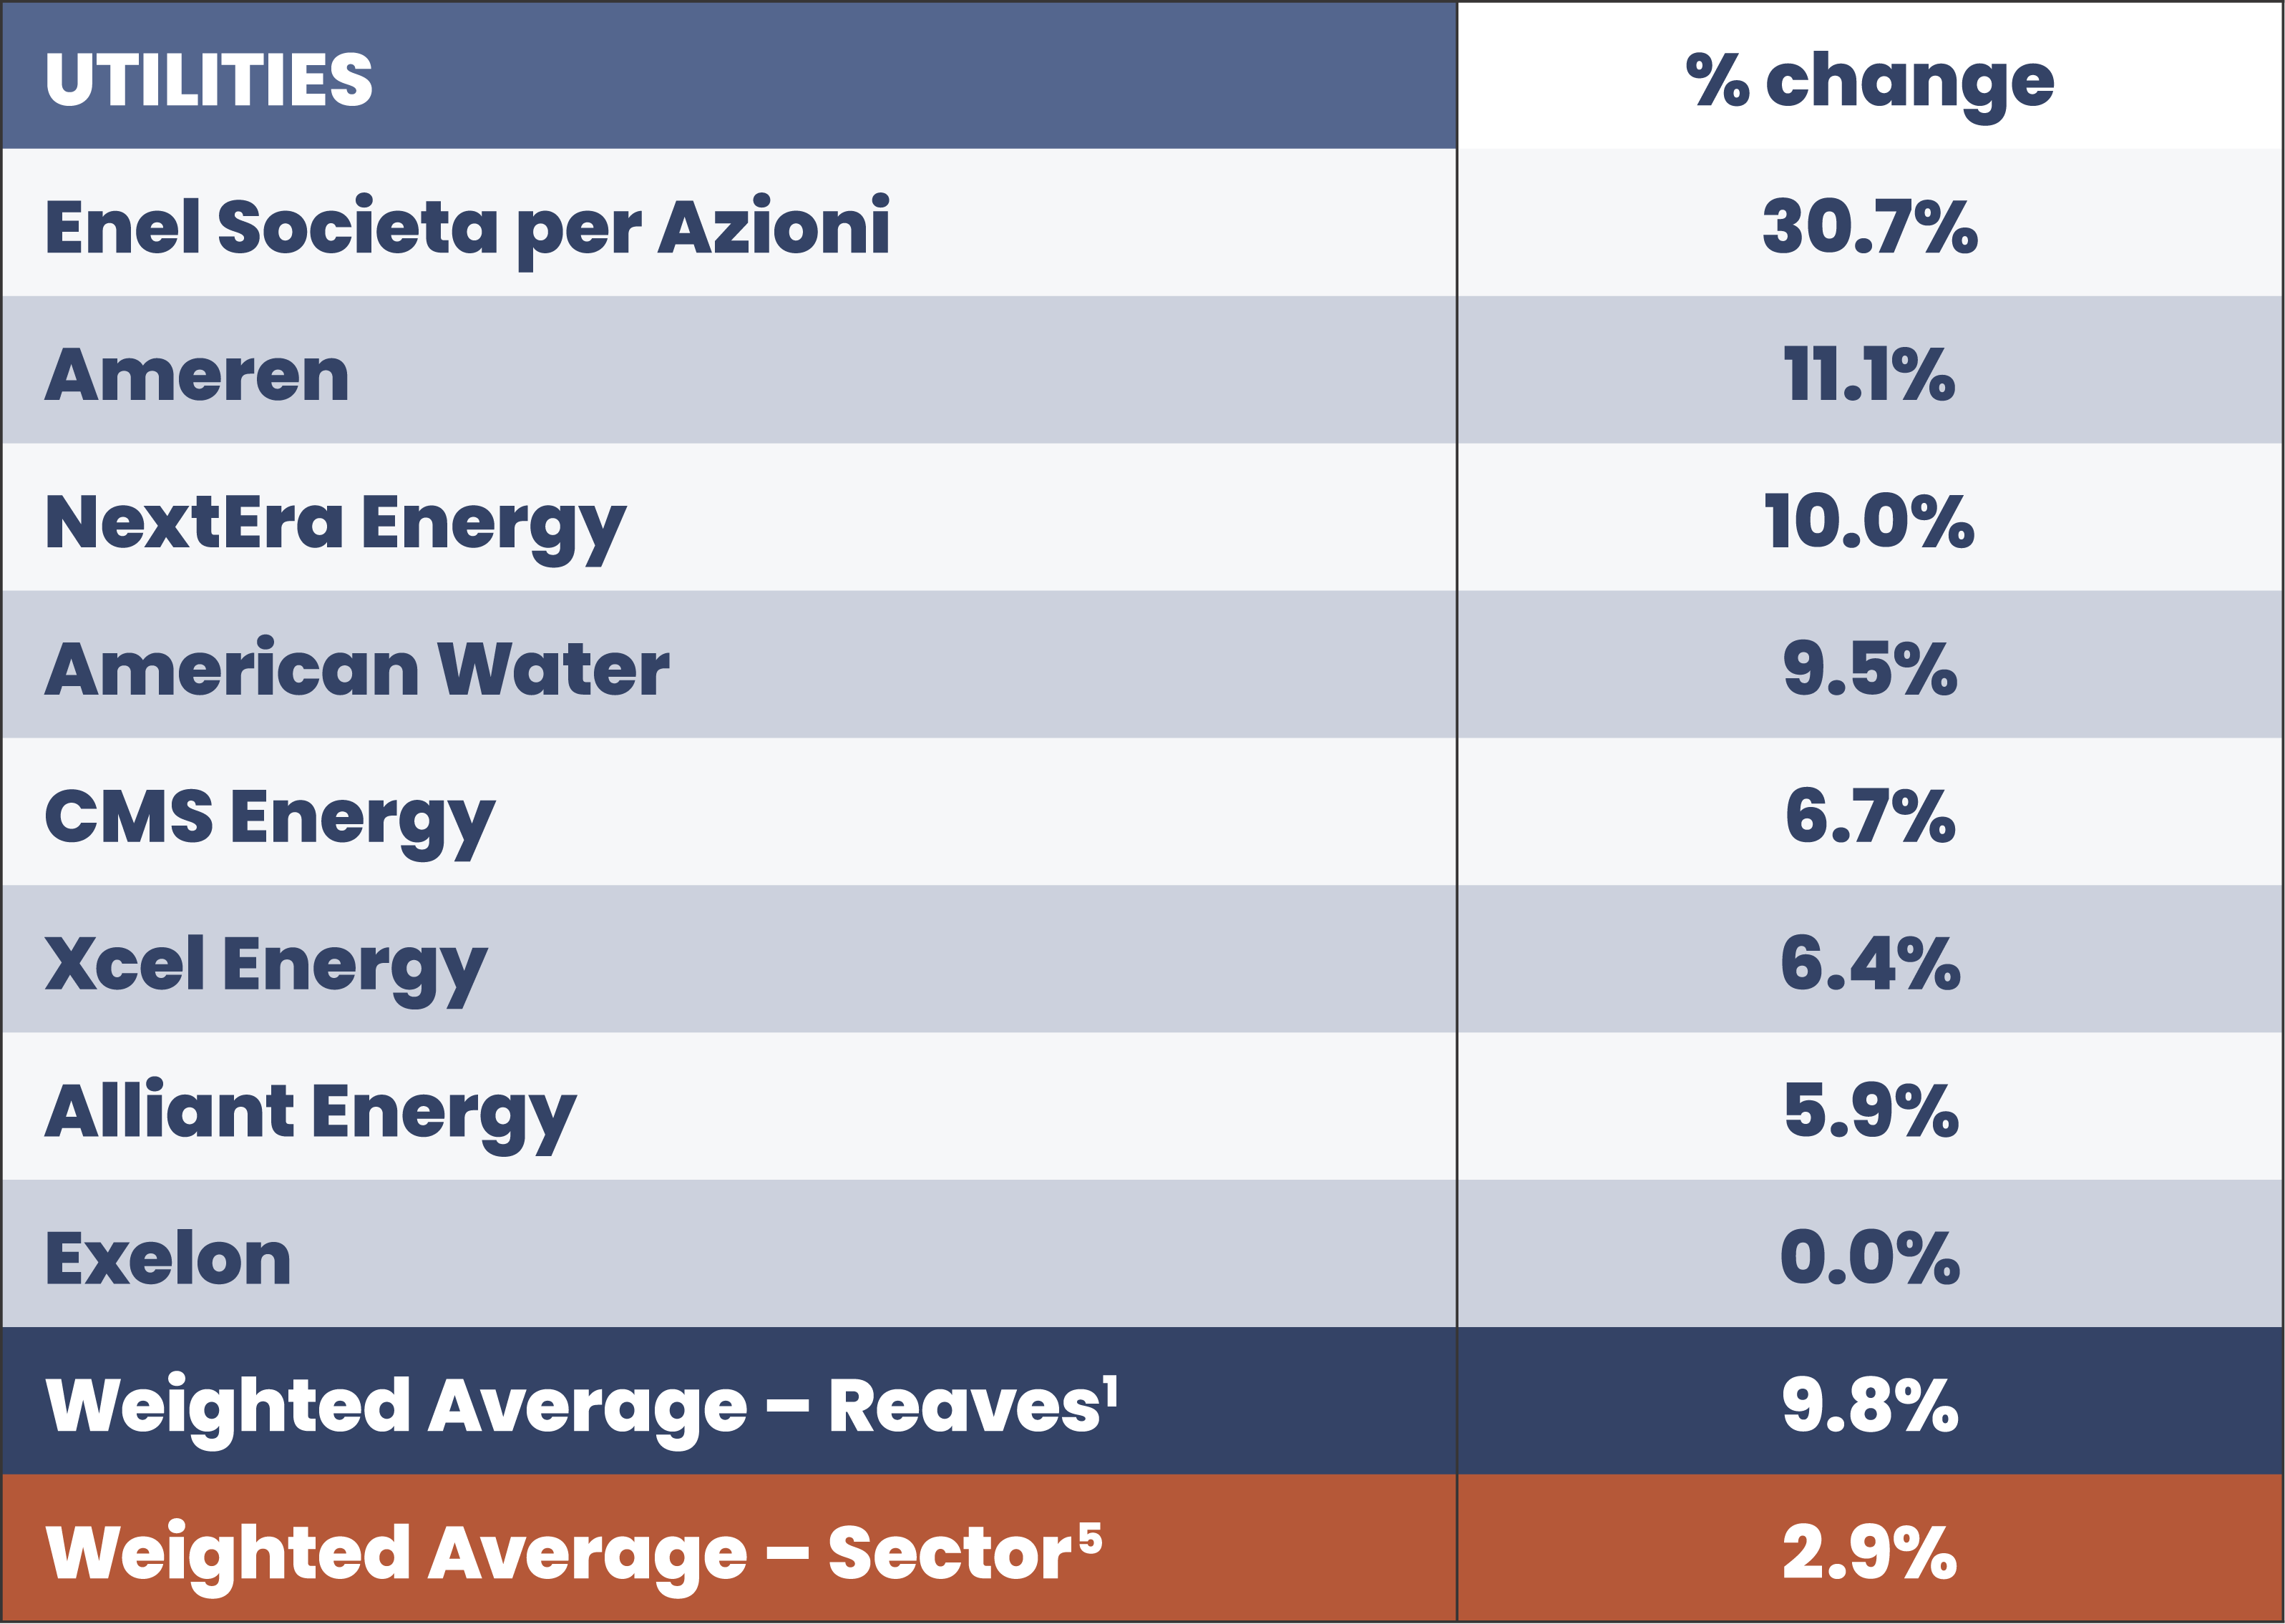
Utilities
The table below shows the annual dividend increase for each Utility stock owned as of June 30, 2021, in a composite of wrap portfolios1 managed with the Reaves Long Term Value Strategy.
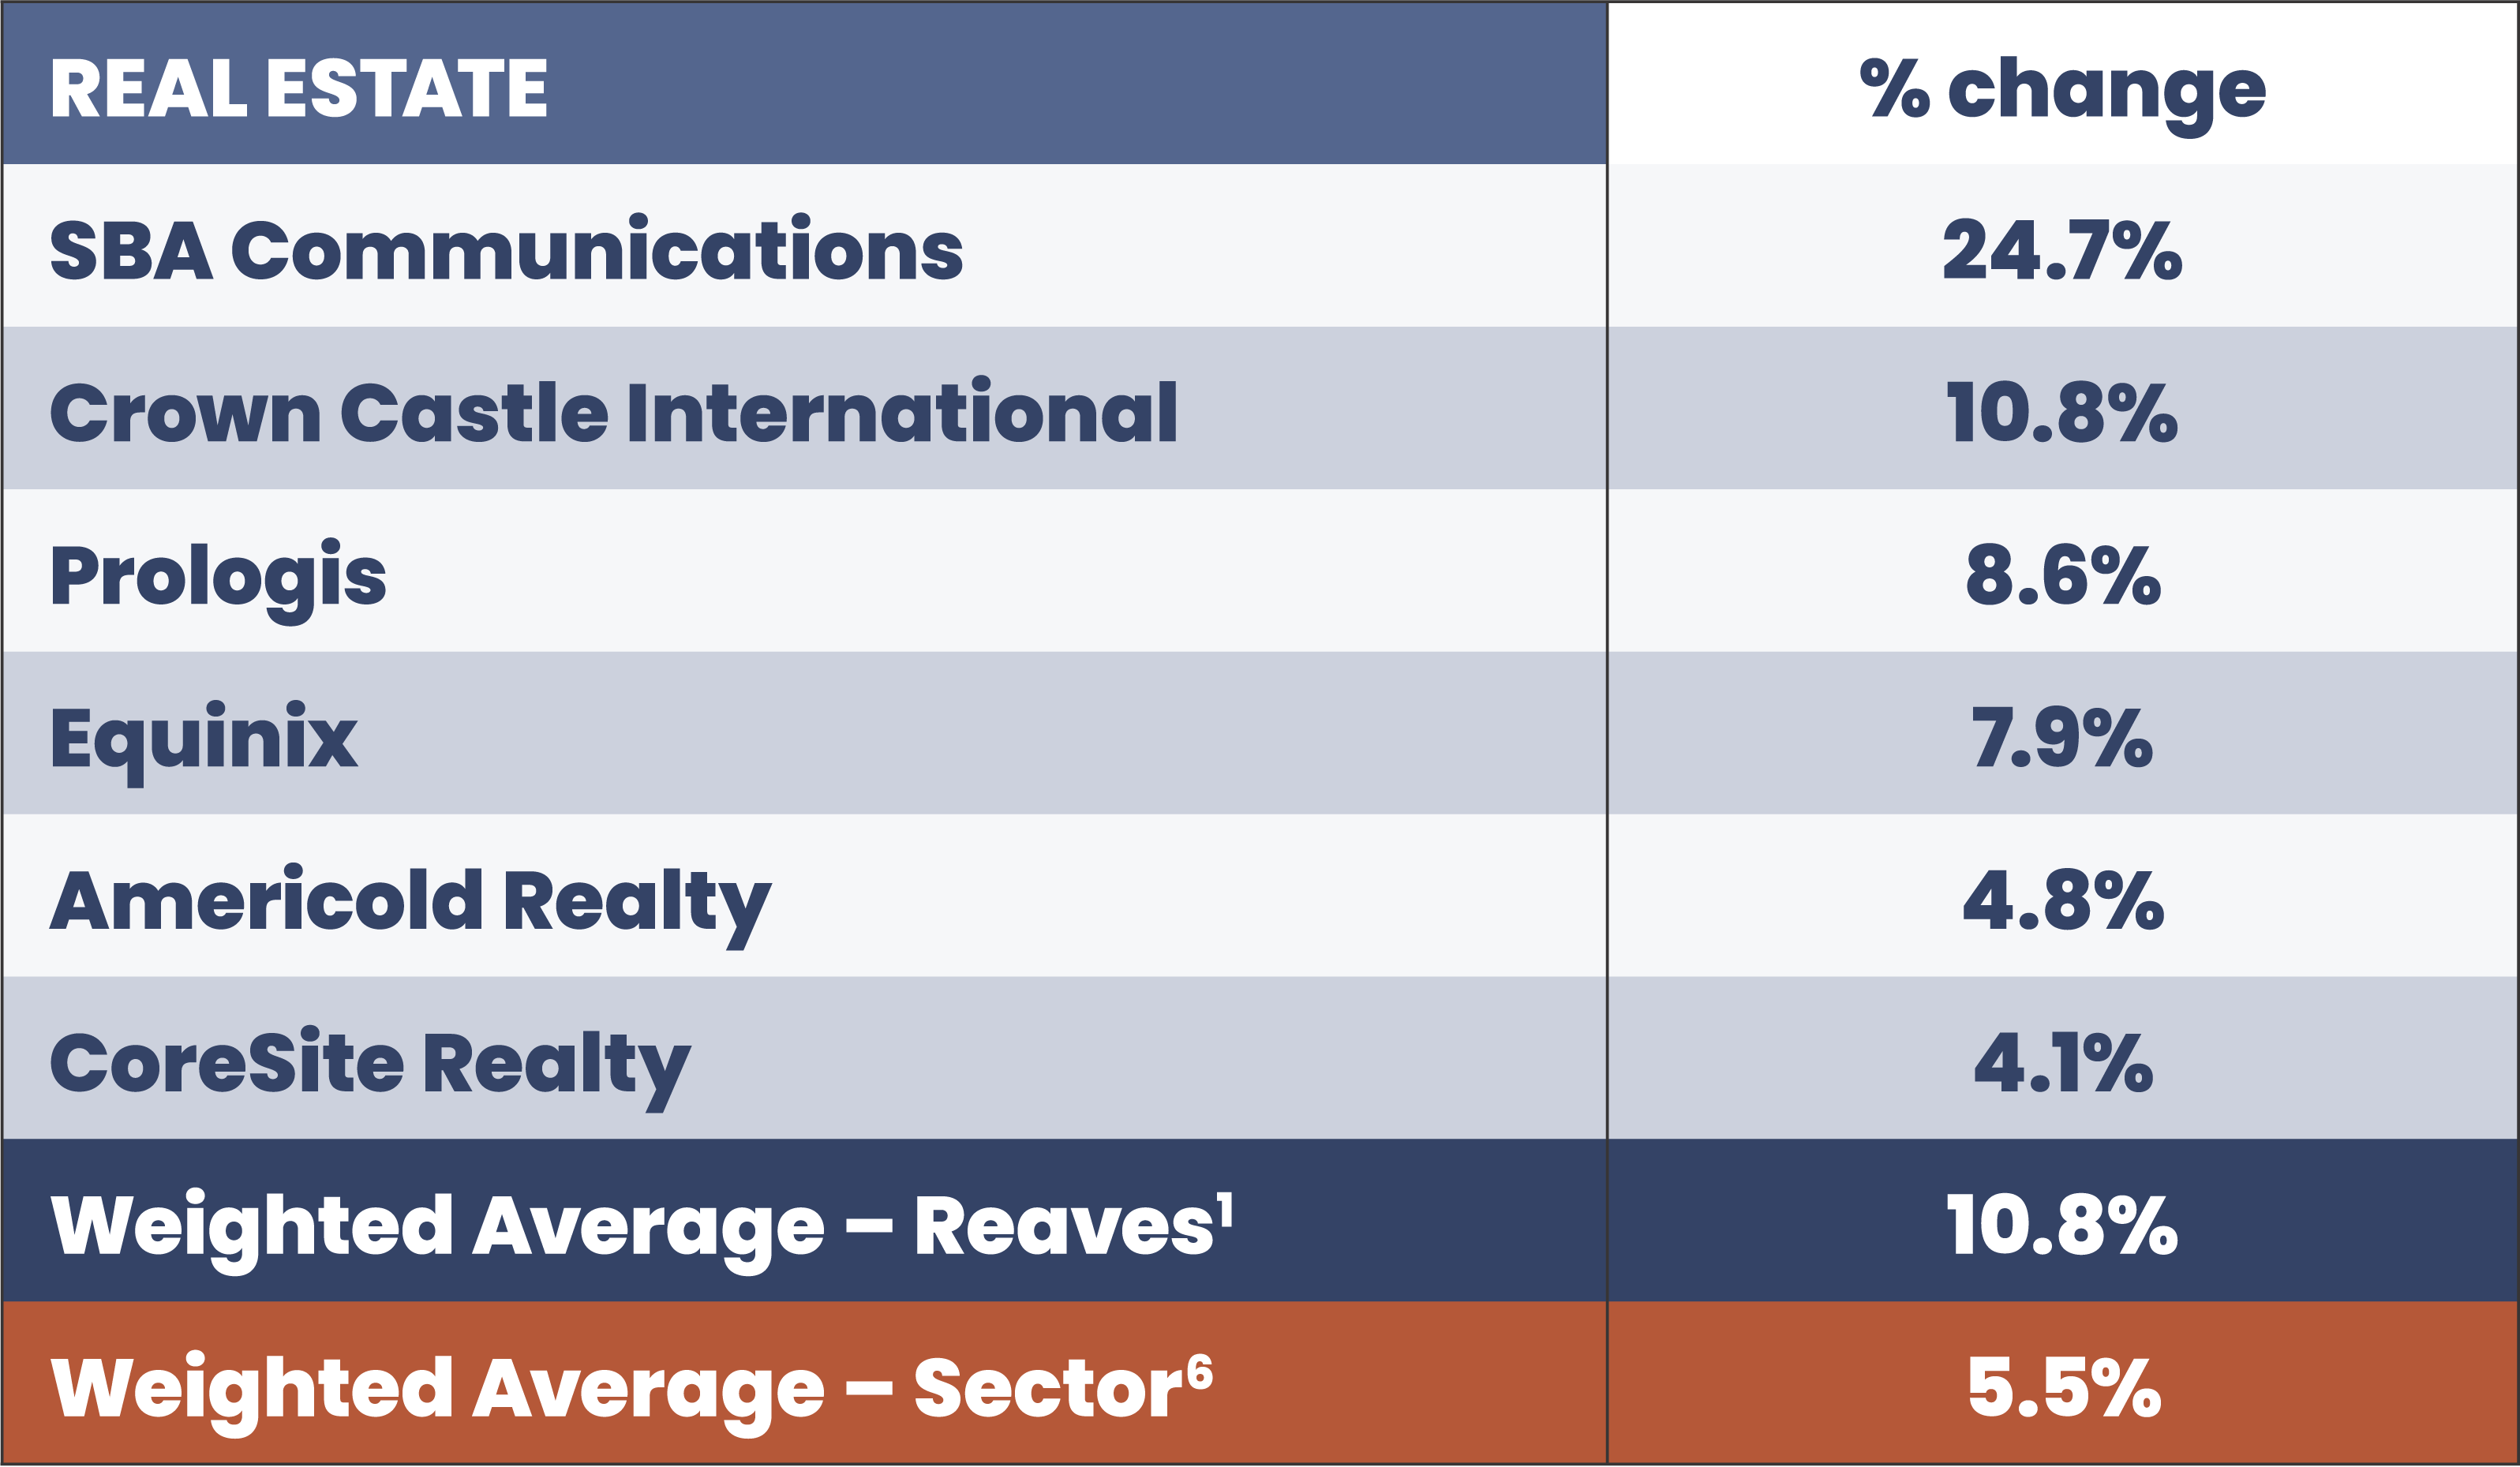
Real Estate
The table below shows the annual dividend increase for each Real Estate stock owned as of June 30, 2021, in a composite of wrap portfolios1 managed with the Reaves Long Term Value Strategy.
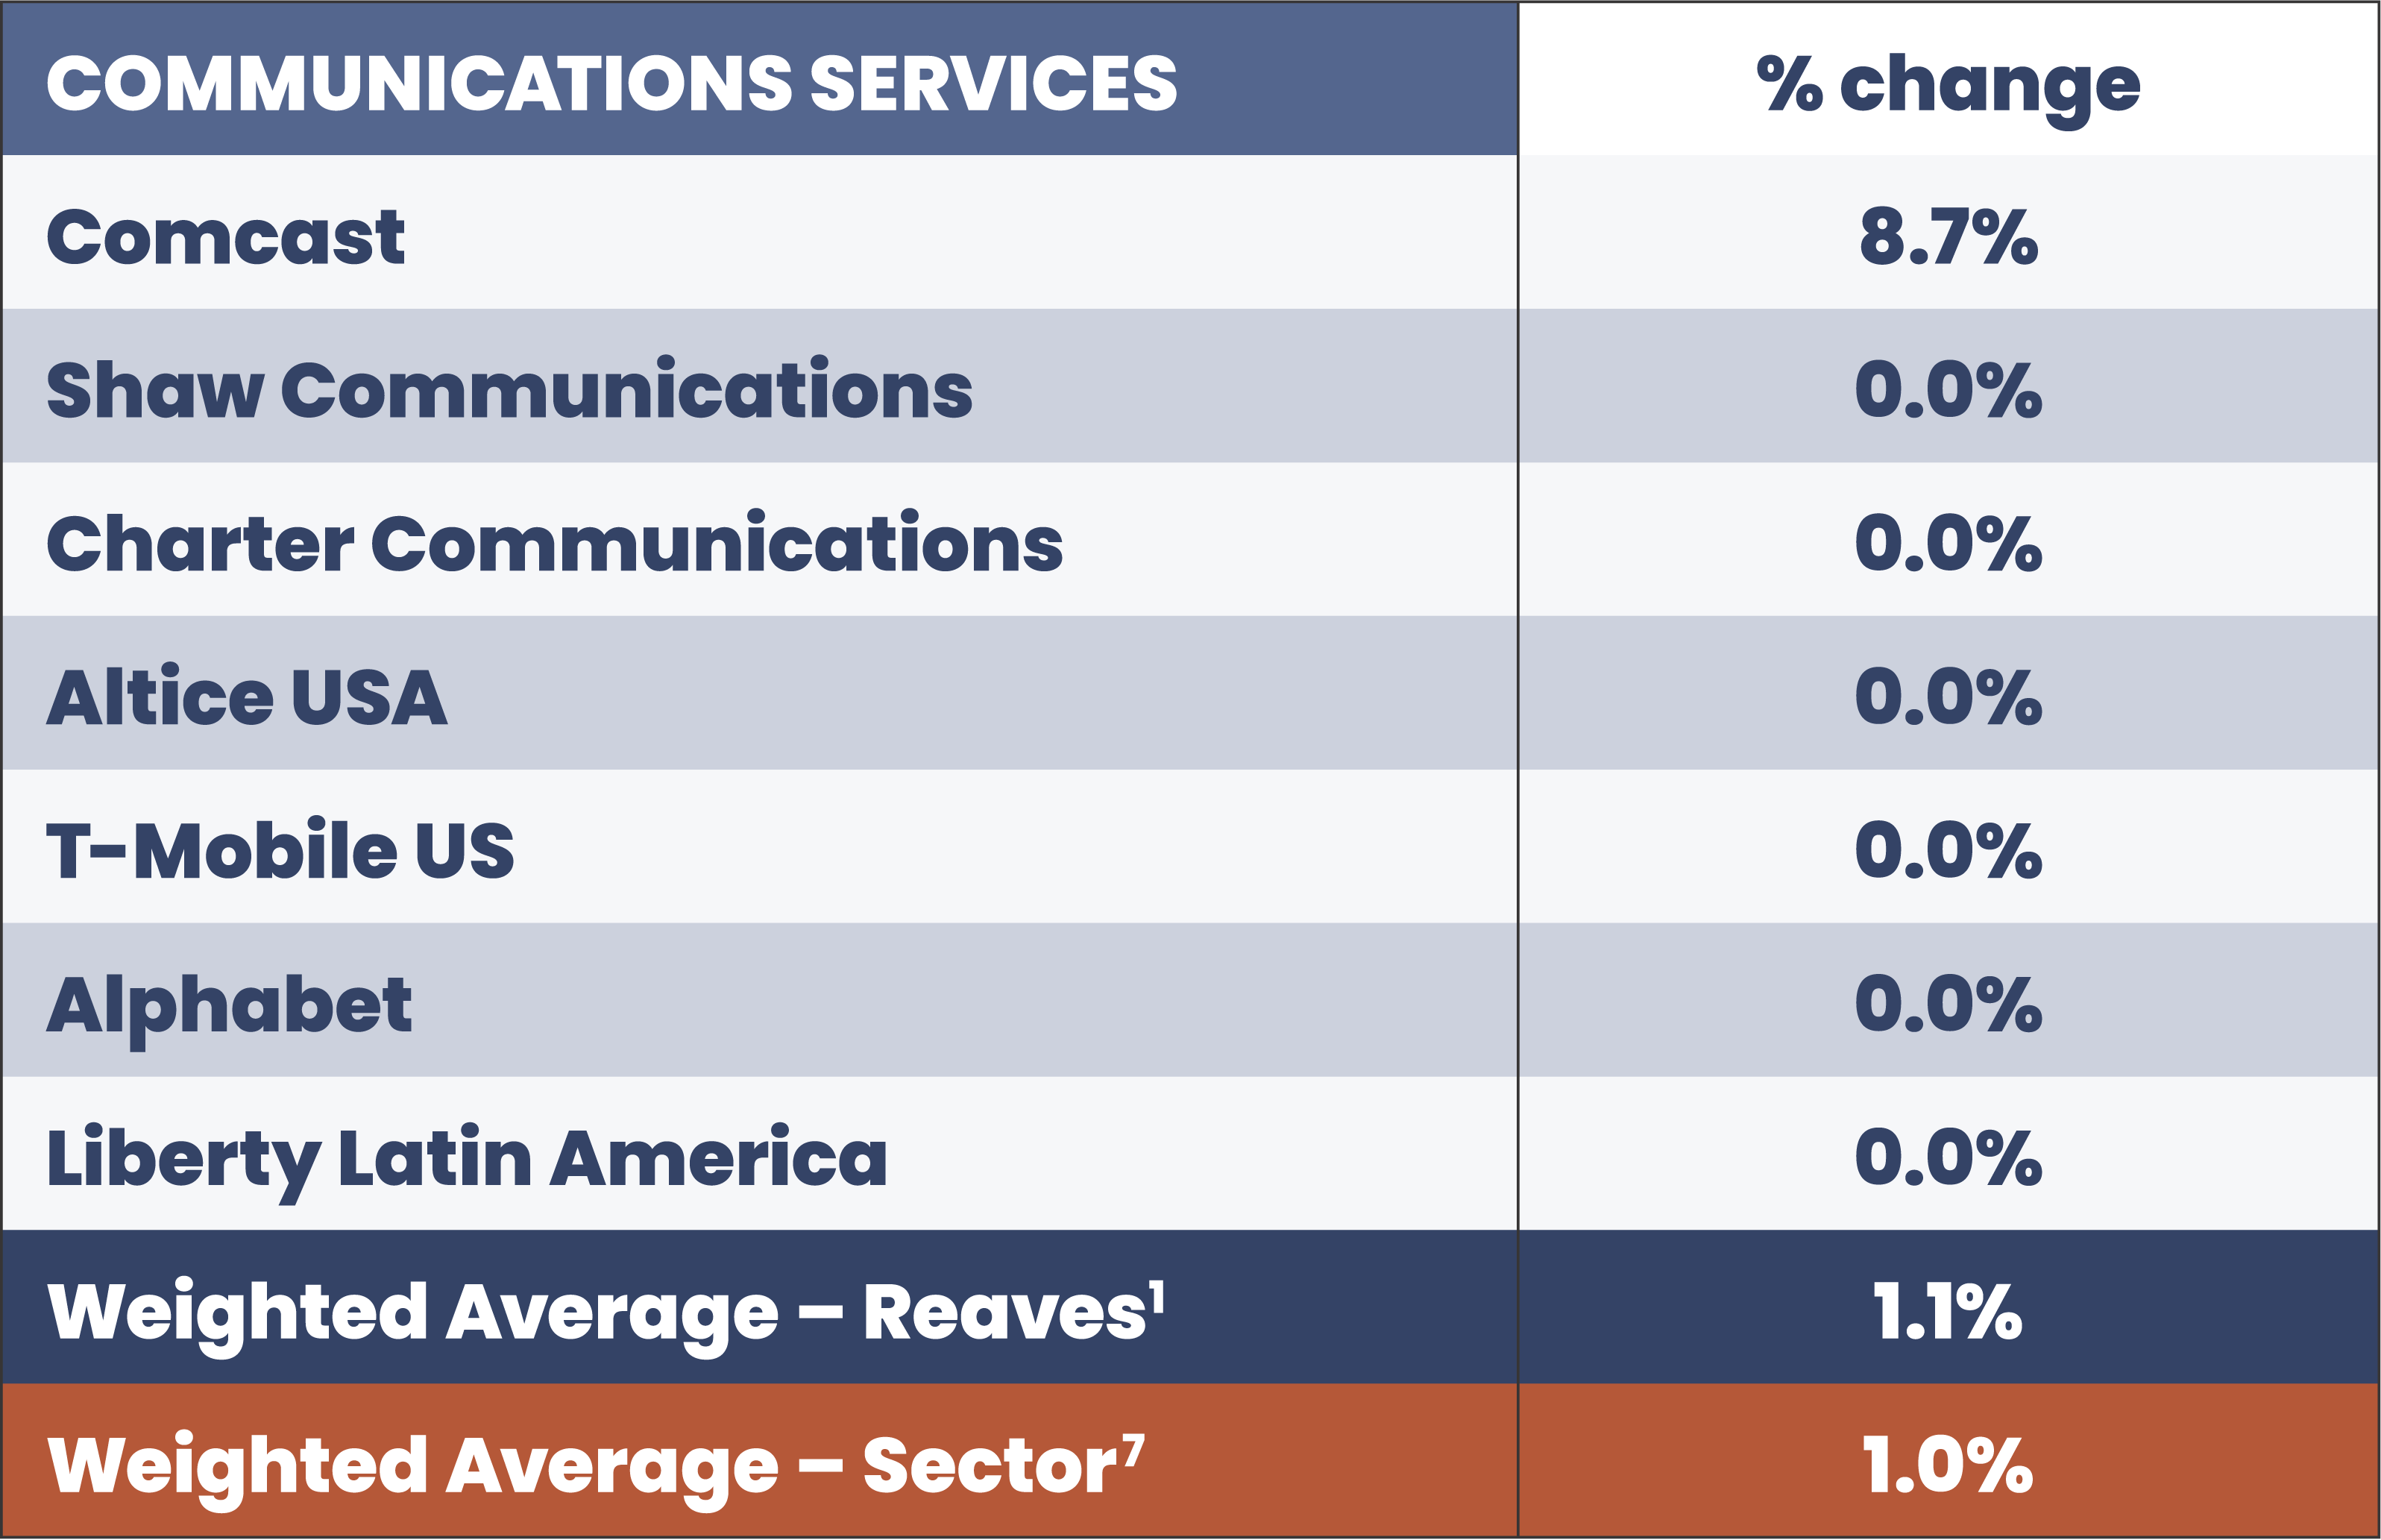
Communications Services
The table below shows the annual dividend increase for each Communications Services stock owned as of June 30, 2021, in a composite of wrap portfolios1 managed with the Reaves Long Term Value Strategy.