The utilities sector had a rough second quarter, lagging the S&P 500 Index1 and corporate bonds2 by considerable margins. The upshot: relative valuations for the utilities sector are attractive, and fundamentals remain strong.
The S&P 500 Utilities Index generated a gain of 2.7% for the quarter, but it trailed the S&P 500 Index by 1,781 basis points and underperformed corporate bonds by 625 basis points. This left the group at its lowest relative valuation to the S&P 500 Index since late 2009, and at its lowest valuation relative to corporate bonds, on a yield basis, since the fourth quarter of 2012.
We believe macroeconomic and technical factors contributed to this recent period of relative underperformance and take solace in the fact that earnings trends and management outlooks for most companies in the sector have been quite positive.
We attribute the lagging performance to three sources. First, and most straightforward, is the government’s effort to stimulate the economy through legislated fiscal policy and Federal Reserve3 monetary policy. Those actions, even in advance of their implementation, improved investor hopes that the economy could aggressively reaccelerate as pandemic restrictions lifted. This favored economically sensitive stocks and sectors within the index, and from a relative standpoint, worked against defensive sectors such as utilities.
On top of that swing in sentiment, the Fed’s unprecedented quantitative easing and programs to buy non-Treasury securities favored securities that might be the ultimate beneficiary of a Fed buying spree. This included corporate and high-yield debt as well as S&P 500 Index products.
Lastly, we believe technical factors also contributed to the sector’s underperformance. Some large, low-volatility funds reduced their exposure to utilities after the sector’s market beta4 increased. We believe the increased beta was temporary, and the result of utilities participating in a broad market sell-off early in the quarter. The effect of that rebalancing was nevertheless significant, with one fund dumping $2 billion of utility stocks into the market on a single trading day in mid-May. Many funds follow non-discretionary rules like this, and it likely added to the selling pressure over the course of the quarter.
Relative Valuations Have Changed, Fundamentals Have Not
Utilities’ recent underperformance has made the sector’s valuation compelling relative to stocks and corporate bonds. For perspective, the utilities sector’s dividend yield spread above the 10-year Treasury is at its widest level in the past 30 years (see chart below). And the sector now trades at a price/earnings ratio5 discount to the S&P 500 Index, after carrying a premium multiple for much of 2018 and 2019. It does so despite the fact that since the beginning of the year, forward earnings estimates for the S&P 500 Index have declined 16% versus a decline of only 3% for the utilities sector.
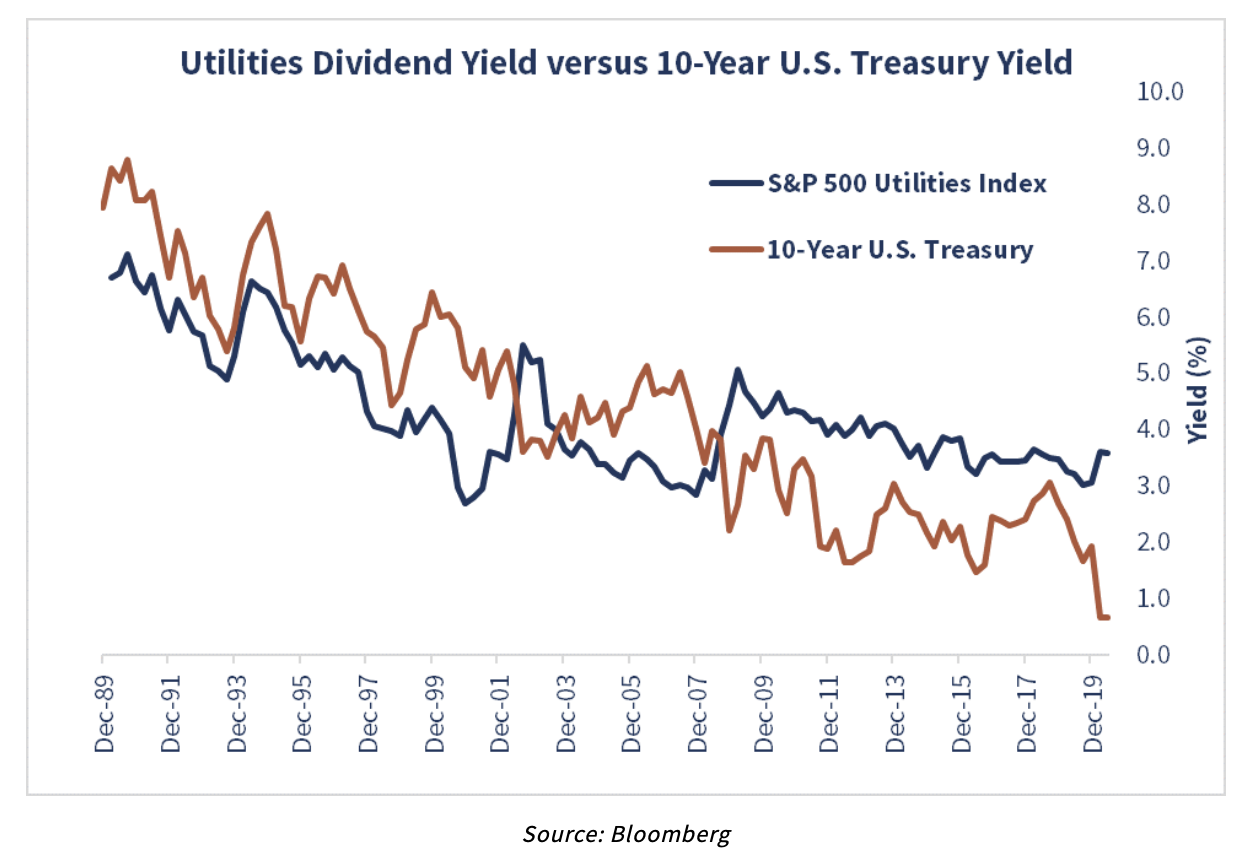 Source: Bloomberg
While the change in relative valuations would seemingly imply a poor outlook for utilities, the view from corporate offices in the first quarter was more sanguine. Overall, utilities issued solid quarterly reports. Most outlooks, from an earnings perspective, were largely unchanged from those provided last year. As the reports rolled out across the weeks of earnings season, there was a clear improvement in management confidence as companies worked through the opening rounds of life in a pandemic.
Going forward, we believe some companies are going to struggle a bit more than others to meet their earnings targets, because of COVID-19. We continue to believe that the utility companies we hold are well positioned to deliver sustained earnings and dividend growth over the next three to five years.
We believe that view, combined with more attractive relative valuations, may have created an opportunity for a timely entry point for investment.

Disclosures:
Reaves Asset Management is an investment adviser registered with the Securities and Exchange Commission under the Investment Advisers Act of 1940. Registration does not imply any skill or training. Reaves is a privately held, independently owned “S” corporation organized under the laws of the State of Delaware.
The information provided in this blog does not constitute, and should not be construed as, investment advice or recommendations with respect to the securities and sectors listed. Investors should consider the investment objective, risks, charges and expenses of all investments carefully before investing. Any projections, outlooks or estimates contained herein are forward looking statements based upon specific assumptions and should not be construed as indicative of any actual events that have occurred or may occur.
1 The S&P 500 Index (“S&P 500) is a capitalization-weighted index of 500 stocks designed to measure performance of the broad domestic economy through changes in the aggregate market value of 500 stocks representing all major industries. The typical Reaves portfolio includes a significant percentage of assets that are also found in the S&P 500. However, Reaves’ portfolios are far less diversified, resulting in higher sector concentrations than found in the broad-based S&P 500.
2 The Bloomberg Barclays U.S. Corporate Investment Grade Bond Index measures the investment grade, fixed-rate, taxable corporate bond index. It includes USD-denominated securities publicly issued by U.S. and non-U.S. industrial, utility and financial issuers. Moody's Baa Corporate Bond, also known as "Moody's Baa" for short, is an investment bond that acts as an index of the performance of all corporate bonds given a Baa rating by Moody’s Investors Service.
3 The Federal Reserve System is the central bank of the U.S. The Fed, as it is commonly known, regulates the U.S. monetary and financial system.
4Beta measures a stock’s volatility relative to the broad market. A stock with a beta higher than 1.0 has historically been more volatile than the market, while a stock with a beta lower than 1.0 has been less volatile.
5 The price/earnings ratio (P/E ratio) is the ratio for valuing a company that measures its current share price relative to its per-share earnings (EPS). The price-to-earnings ratio is also sometimes known as the price multiple or the earnings multiple.
Past performance is no guarantee of future results.
All investments involve risk, including loss of principal.
All data is presented in U.S. dollars.
Important Tax Information: Reaves Asset Management and its employees are not in the business of providing tax or legal advice to taxpayers. Any such taxpayer should seek advice based on the taxpayer’s particular circumstances from an independent tax adviser.