Disclosures and Definitions:
Reaves Asset Management is an investment adviser registered with the Securities and Exchange Commission under the Investment Advisers Act of 1940. Registration does not imply any skill or training. Reaves is a privately held, independently owned “S” corporation organized under the laws of the State of Delaware.
The information provided in this blog does not constitute, and should not be construed as, investment advice or recommendations with respect to the securities and sectors listed. Investors should consider the investment objective, risks, charges and expenses of all investments carefully before investing. Any projections, outlooks or estimates contained herein are forward looking statements based upon specific assumptions and should not be construed as indicative of any actual events that have occurred or may occur.
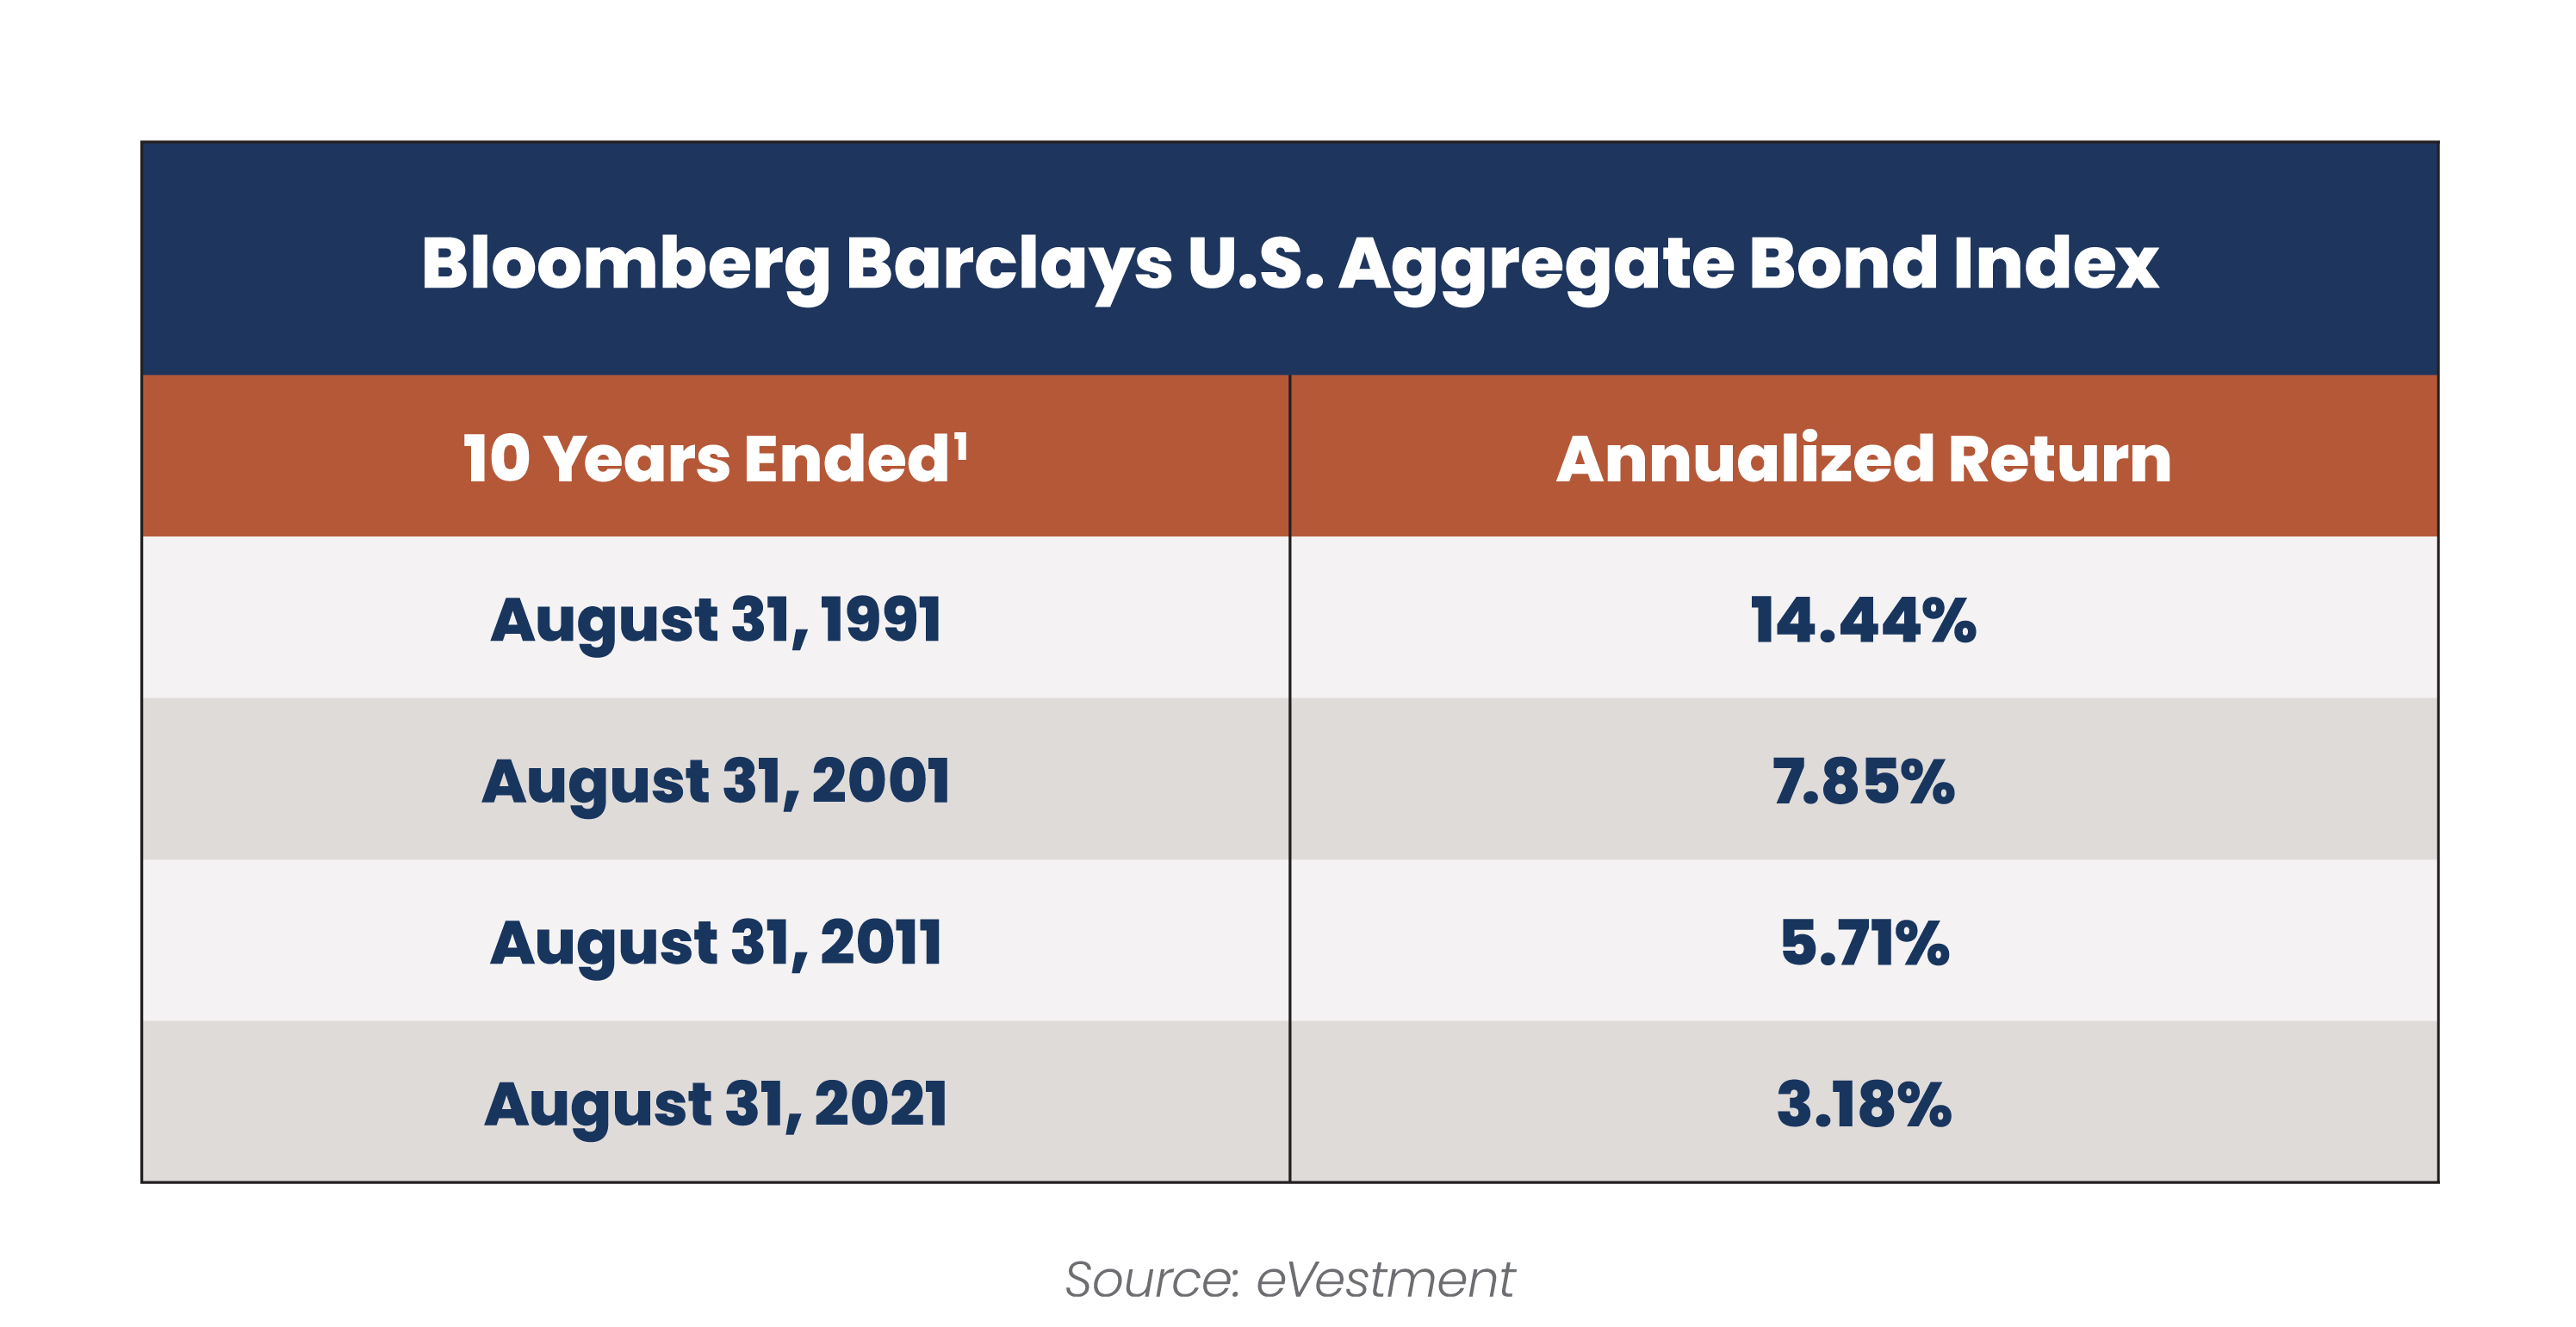
1For the data in the chart, we are showing 40 years because interest rates peaked in the Fall of 1981. In the first 10-year period, as indicated, bond returns were very high because interest rates were dropping from very high rates. In the next three 10-year periods, rates were still declining but at a slower rate, causing bond returns to decrease.
The Bloomberg Barclays U.S. Aggregate Bond Index is an index comprised of approximately 6,000 publicly traded bonds including U.S. Government, mortgage-backed, corporate, and Yankee bonds with an approximate average maturity of 10 years.
The annualized rate of return is a process for determining investment returns on an annual basis. The rate of return looks at gains and losses on investments over varying periods of time, while the annualized rate looks at the returns on a yearly basis.
Past results do not guarantee future performance. Further, the investment return and principal value of an investment will fluctuate; thus, investor’s equity, when liquidated, may be worth more or less than the original cost. This document provides only impersonal advice and/or statistical data and is not intended to meet objectives or suitability requirements of any specific individual or account.
All investments involve risk, including loss of principal.
All data is presented in U.S. dollars.
Cash is cash and cash equivalents.
An investor cannot invest directly in an index.
Important Tax Information: Reaves Asset Management and its employees are not in the business of providing tax or legal advice to taxpayers. Any such taxpayer should seek advice based on the taxpayer’s own individual circumstances from an independent tax adviser.
Fees: Net performance reflects the deduction of advisory fees which are described in detail in our Form ADV Part 2A.
Please contact your financial professional, or click the following links, for a copy of Reaves’ Form ADV Part 2A and Form CRS.
Additional information about Reaves may be found on our website: www.reavesam.com.
2021 © Reaves Asset Management (W. H. Reaves & Co., Inc.)