Reality-Defying Rally Provides Opportunity to Reassess Drawdown Risk

As the unemployment rate hit its highest level since the Great Depression (1929-1939), U.S. stock markets recovered roughly half their losses from March’s bear market. If that rally seems unjustified, you aren’t alone. The divergence between stock market performance and economic reality has grabbed a lot of attention in the past couple weeks, but a column in The Economist+ may have described the enigma best, noting that:

“...the mood of markets can shift suddenly, as an extraordinary couple of months has proved. A one-month bear market scarcely seems enough time to absorb all the possible bad news from the pandemic and the huge uncertainty it has created. This stock market drama has a few more acts yet.”

If the market’s next act is another leg down, the previous acts have at least afforded investors opportunity to prepare. Before March’s downturn, advisors had little reason to think about downside protection within their equity portfolios. An 11-year long bull market provided few opportunities to see how client portfolios would weather a downturn.

March’s tumult offered a glimpse of how those portfolios would withstand a market decline, and a rebound has provided a breather to implement changes before another potential fall. Going forward, we believe investors will benefit from including equity strategies that are designed to limit drawdowns.

At Reaves, we have long sought to reduce drawdown risk by focusing our investments on companies that are most essential to the economy. In a recent Q&A, Reaves CEO Jay Rhame explained the approach:

“The consistency of our downside protection comes by design. The types of companies we buy are naturally defensive investments. They provide non-discretionary, essential services with lower risk of earnings declines, even in recession. Investors flock to these sectors in times of uncertainty.”

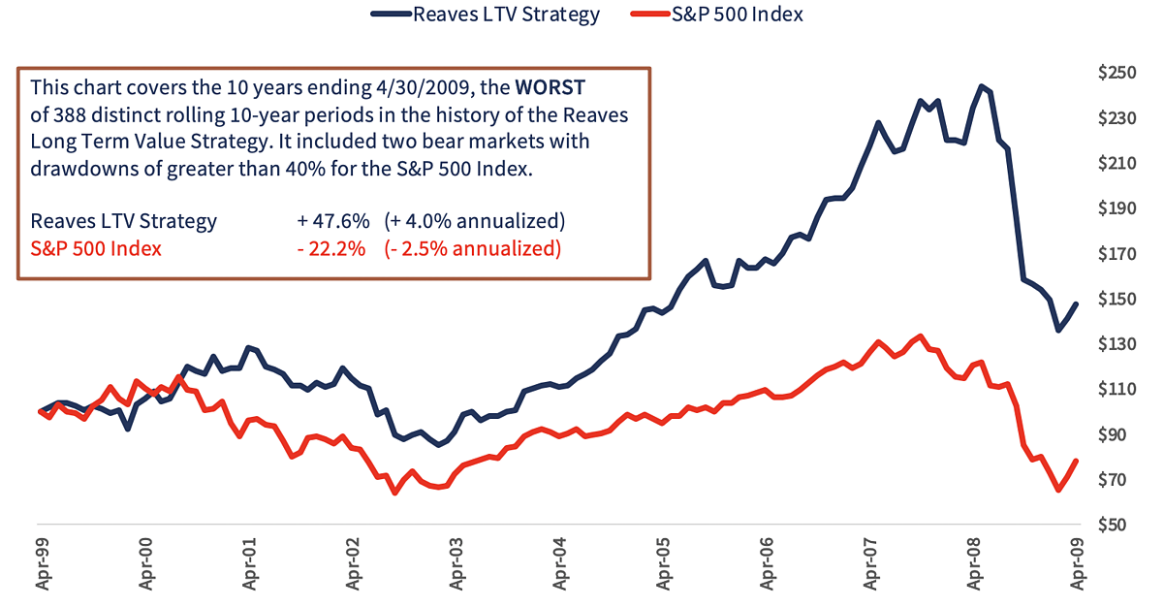
The chart below shows how Reaves’ Long Term Value Strategy held up in one of the worst 10-year market periods in history. The era got off to a decent start before the tech bubble burst, but then included two bear markets and a -22.2% cumulative loss for the S&P 500 index. Through that same time period, Reaves’ Long Term Value Strategy gained 47.6%.

While we don’t know what the market’s next act will be, the dislocation between the market rally and economic reality suggests advisors may want to prepare their clients for another potential decline. We believe our strategies can help.


Reaves LTV Strategy - S&P 500


Data is for the Reaves Asset Management LTV ERISA Composite, net of fees, which ended on 12/20/19.
385 rolling 10-year periods ending Dec 1987 – Nov 2019 = Reaves LTV ERISA Composite*
3 rolling 10-year periods ending Dec 2019 – Mar 2020 = Reaves LTV Wrap Composite**
Reaves LTV ERISA Composite: inception 01/01/78 and ended 12/20/2019
Reaves LTV Wrap Composite: inception 12/31/02
Source: eVestment Analytics
This chart does not represent all periods under management.
See below for additional disclosures and definitions.

Q&A with the CEO & Co-Portfolio Manager of Reaves Asset Management, Jay Rhame

Reaves Asset Management is an investment adviser registered with the Securities and Exchange Commission under the Investment Advisers Act of 1940. Registration does not imply any skill or training. Reaves is a privately held, independently-owned “S” corporation organized under the laws of the State of Delaware.

The information provided in this blog does not constitute, and should not be construed as, investment advice or recommendations with respect to the securities and sectors listed. Investors should consider the investment objective, risks, charges and expenses of all investments carefully before investing. Any projections, outlooks or estimates contained herein are forward looking statements based upon specific assumptions and should not be construed as indicative of any actual events that have occurred or may occur.

Reaves’ Long Term Value Strategy (Reaves LTV Strategy) seeks a high risk-adjusted total return. The strategy tends to be invested in relatively larger companies with strong balance sheets, good cash flow and a history of dividend growth. Core positions are accumulated in financially strong, high-quality companies and generally have the following characteristics: strong management, above industry-average growth rates, large/mid-market capitalization and low price-earnings multiples.

* Reaves performance data is the Reaves LTV ERISA Composite and, unless otherwise noted, all data is net of fees. The Reaves LTV ERISA Composite reflects the dollar-weighted return of all corporate ERISA pension accounts with assets of at least $1,000,000 under management for all periods presented (the minimum was $900,000 during the period 08/31/10-06/22/12). Returns are time-weighted and include the reinvestment of all dividends and other earnings, net of commissions. The LTV ERISA Composite does not reflect all of the Reaves’ assets under management. The LTV ERISA Composite ended on 12/20/19.

** Beginning December 2019, Reaves LTV Strategy is represented by the LTV SMA Wrap Composite. This composite contains those LTV discretionary portfolios with wrap (bundled) fees. Wrap accounts are charged a bundled fee which includes the wrap sponsor fee, as well as, Reaves’ investment advisory fee. Due to compliance requirements, the net-of-fees calculation is computed based on the highest annual fee assigned by any wrap sponsor who utilizes this portfolio in an investment wrap program (300 basis points from 1/1/03 through 12/31/16 and, effective 1/1/2017, 250 basis points).  The LTV SMA Wrap Composite performance consists of money-weighted, time-weighted returns and it includes the reinvestment of all dividends and other earnings. The inception date of the composite is December 2002; however, the composite was created in January 2013. This composite has been managed in a similar manner to the LTV ERISA Composite which ended in December of 2019. The LTV SMA Wrap Composite does not represent all of Reaves’ assets under management.

+ The Economist, May 7, 2020, https://www.economist.com/leaders/2020/05/07/the-market-v-the-real-economy

All references to market or markets is the S&P 500 Index of common stocks.

Rolling returns reflect the cumulative return on a continuously held investment over a number of consecutive periods, calculated monthly.

Bull Market is a period of several months or years during which asset prices consistently rise.

Bear Market is a period of several months or years during which securities prices consistently fall.

Drawdown is the peak-to-trough (highest point to lowest point) decline during a specific recorded period of an investment, fund or commodity. A drawdown is usually quoted as the percentage between the peak and the subsequent trough.

The S&P 500 Index is a capitalization-weighted index of 500 stocks designed to measure performance of the broad domestic economy through changes in the aggregate market value of 500 stocks representing all major industries. The typical Reaves portfolio includes a significant percentage of assets that are also found in the S&P 500. However, Reaves’ portfolios are far less diversified, resulting in higher sector concentrations than found in the broad-based S&P 500 Index.

Past performance is no guarantee of future results.
All investments involve risk, including loss of principal.
All data is presented in U.S. dollars.

Important Tax Information: Reaves Asset Management and its employees are not in the business of providing tax or legal advice to taxpayers. Any such taxpayer should seek advice based on the taxpayer’s particular circumstances from an independent tax adviser.

Receive utility, energy & communication insights

from four decades of intelligent investing