Utilities Sector: Reasons for Optimism?

Reaves Asset Management is attracted to companies that provide essential infrastructure services with characteristics such as high barriers to entry, limited competition, low risk of bankruptcy, and the ability to grow cash flow, earnings, and dividends through all economic cycles. We believe utility companies check all these boxes which explains why their stocks have been core holdings in portfolios managed with our Long Term Value Strategy1 since we entered the investment management business in 1978.

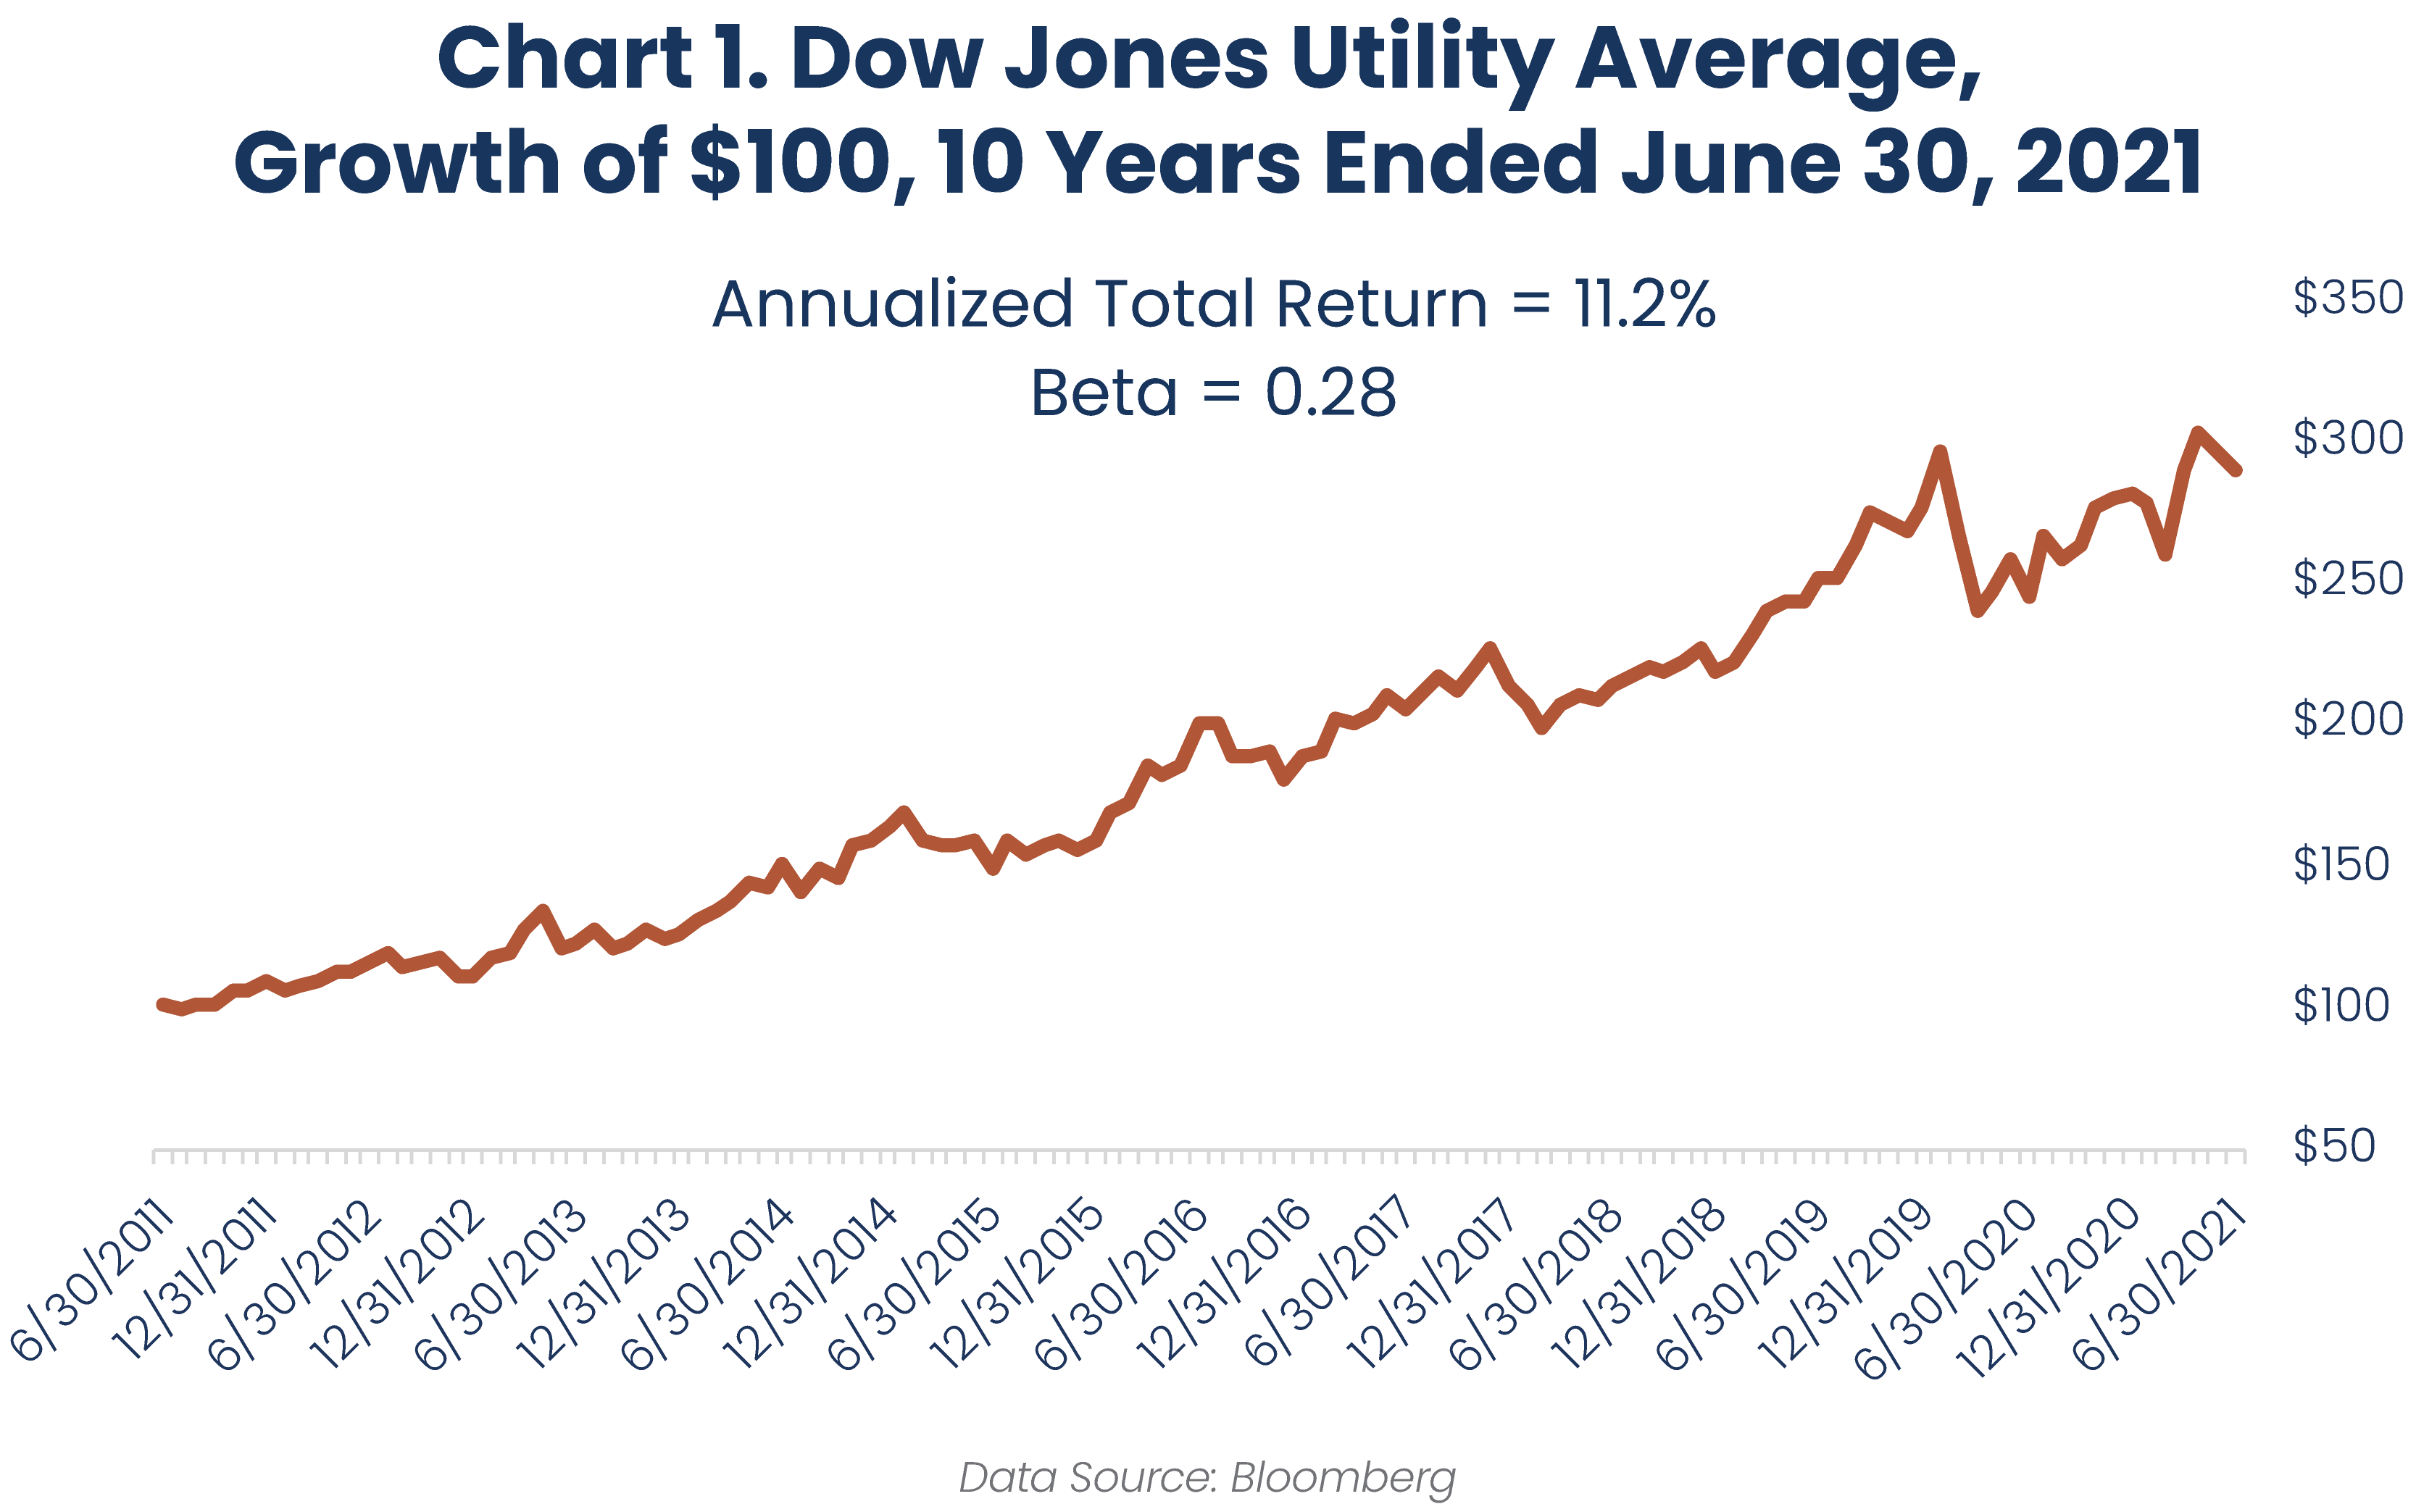
While the sector is rarely hyped by Wall Street strategists or market commentators who regularly appear on financial TV and radio, utilities2 have quietly delivered an annualized return of 10.9%, including dividends, over the past 43.5 years while posting a low beta of 0.44 relative to the S&P 500 Index. The chart below illustrates the hypothetical growth of $100, with reinvested dividends, over the 10 years ended 6/30/21 if an investor could have achieved similar returns to the Dow Jones Utility Average (DJUA). Notably, the returns and volatility of the DJUA over the past 10 years have been consistent with the historical returns cited above.

2021.07 Reaves Blog 60 Chart 1

As we have written in several prior blogs, we believe the long-term growth tailwinds ongoing in the sector support our positive outlook for many utility companies. First and foremost, the transition away from fossil fuel-based generation to renewables, primarily wind and solar, is a multi-decade opportunity for utilities to invest capital to improve the environmental impact of their generation mix while in turn increasing rate base, a primary source of earnings growth. In the near term, proposed infrastructure legislation by the current administration highlights the significant investment incentives utilities are expected to receive in their continuing efforts to reduce carbon emissions, harden and upgrade electrical grids and transmission lines, and replace the aging water infrastructure necessary for the distribution of clean drinking water.

In addition, the electrification of transportation, supported by the growing adoption of electric vehicles, offers the possibility of growth in the demand for electricity, which has been relatively flat for the past 10 years. With widespread support from both politicians and state regulators for initiatives that combat climate change, we expect many utilities to enjoy constructive relationships with these parties in their efforts to strengthen and build out the infrastructure necessary to support electric vehicle adoption growth.

We have also observed several recent examples of utility holding companies simplifying their businesses by divesting non-core subsidiaries not directly related to the transmission or generation of electricity. We believe these initiatives are a sign of increasing confidence by management teams of the strength and future growth opportunities for their regulated businesses. This is supported by the more than 8% weighted average dividend growth of the holdings in our Long Term Value Wrap Composite in the past year.3 We would argue that such raises speak volumes about management team confidence in future growth potential.

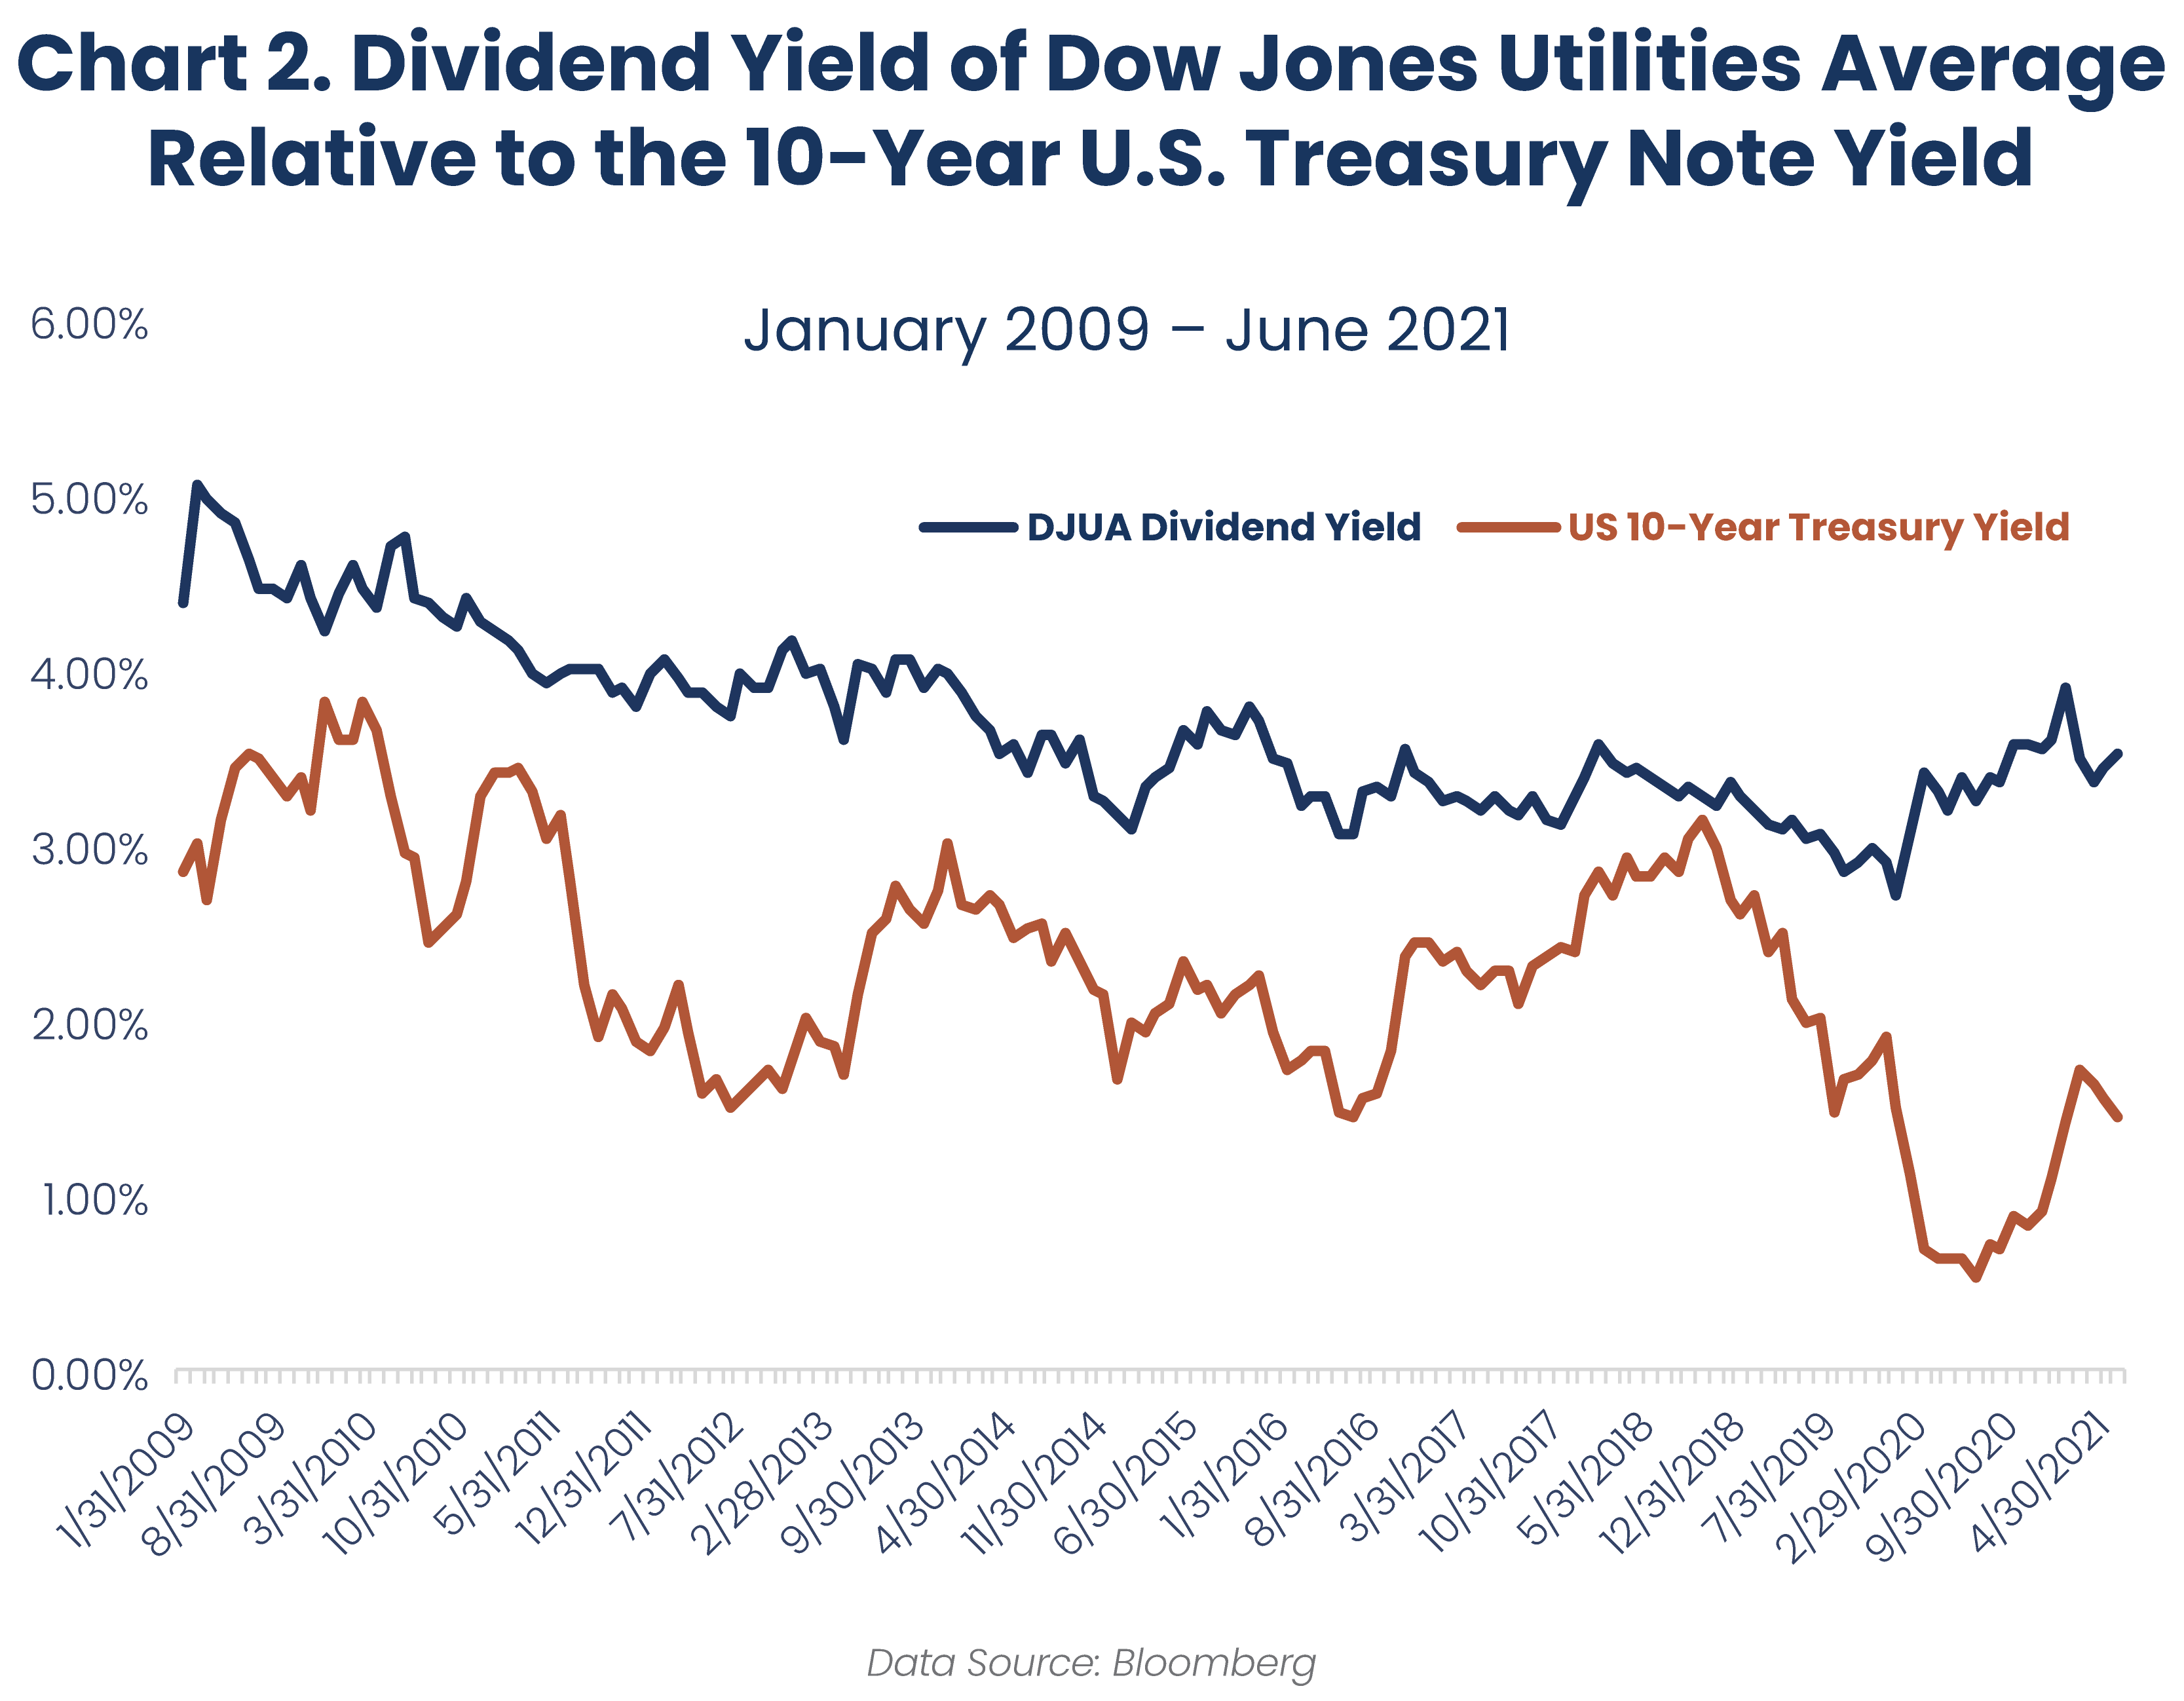
In our view, current valuations are also attractive. The chart below shows that the dividend yield of the Dow Jones Utility Average has remained above the yield of the 10-Year U.S. Treasury Note since early 2009, providing a margin of safety should interest rates move higher. The current spread, as of 6/30/21, is in excess of 200 basis points and near the upper end of the range since 2009.

2021.07 Reaves Blog 60 Chart 2

At Reaves, we believe that a competitive dividend yield combined with mid-to high single digit growth in earnings and dividends is the recipe for achieving the steady, compounding growth we seek in our managed portfolios. We remain optimistic that utilities will continue to make a steady and healthy contribution to the future returns of our managed portfolios.

For our further thoughts about the utilities sector, we encourage you to review these previous blog posts:


Disclosures:

Reaves Asset Management is an investment adviser registered with the Securities and Exchange Commission under the Investment Advisers Act of 1940. Registration does not imply any skill or training. Reaves is a privately held, independently owned “S” corporation organized under the laws of the State of Delaware.

The information provided in this blog does not constitute, and should not be construed as, investment advice or recommendations with respect to the securities and sectors listed. Investors should consider the investment objective, risks, charges and expenses of all investments carefully before investing. Any projections, outlooks or estimates contained herein are forward looking statements based upon specific assumptions and should not be construed as indicative of any actual events that have occurred or may occur.

1Beginning December 2019, Reaves LTV Strategy is represented by the LTV SMA Wrap Composite. This composite contains those LTV discretionary portfolios with wrap (bundled) fees. Wrap accounts are charged a bundled fee which includes the wrap sponsor fee as well as Reaves’ investment advisory fee. Due to compliance requirements, the net-of-fees calculation is computed based on the highest annual fee assigned by any wrap sponsor who utilizes this portfolio in an investment wrap program (300 basis points from 1/1/03 through 12/31/16 and, effective 1/1/2017, 250 basis points). The LTV SMA Wrap Composite performance consists of money-weighted, time-weighted returns and it includes the reinvestment of all dividends and other earnings. The inception date of the composite is December 2002; however, the composite was created in January 2013. This composite has been managed in a similar manner to the LTV ERISA Composite which ended in December of 2019. The LTV SMA Wrap Composite does not represent all of Reaves’ assets under management.

2Performance data cited is for the Dow Jones Utility Average

3The weighted average dividend increase of 8.3% over the past 12 months was calculated based on the holdings in the LTV Wrap Composite portfolios as of 6/30/21.

The S&P 500 Index (“S&P 500”) is a capitalization-weighted index of 500 stocks designed to measure performance of the broad domestic economy through changes in the aggregate market value of 500 stocks representing all major industries. The typical Reaves portfolio includes a significant percentage of assets that are also found in the S&P 500. However, Reaves’ portfolios are far less diversified, resulting in higher sector concentrations than found in the broad-based S&P 500.

The Dow Jones Utility Average (“DJUA”) is one of the Dow Jones index groups that tracks the performance of 15 prominent utility stocks traded in the United States. It is a price-weighted average. Dow Jones first created the DJUA back in 1929 after removing all utility stocks from the Dow Jones Industrial Average.

The 10-Year U.S. Treasury note is a debt obligation issued by the United States government with a maturity of 10 years upon initial issuance. A 10-Year U.S. Treasury note pays interest at a fixed rate once every six months and pays the face value to the holder at maturity. The U.S. government partially funds itself by issuing 10-Year U.S. Treasury notes.

Weighted average is a calculation that takes into account the varying degrees of importance of the numbers in a data set. In calculating a weighted average, each number in the data set is multiplied by a predetermined weight before the final calculation is made.

Beta measures a stock’s volatility relative to the broad market. A stock with a beta higher than 1.0 has historically been more volatile than the market, while a stock with a beta lower than 1.0 has been less volatile.

Past results do not guarantee future performance. Further, the investment return and principal value of an investment will fluctuate; thus, investor’s equity, when liquidated, may be worth more or less than the original cost. This document provides only impersonal advice and/or statistical data and is not intended to meet objectives or suitability requirements of any specific individual or account.

All investments involve risk, including loss of principal. All data is presented in U.S. dollars.
Cash is cash and cash equivalents.
An investor cannot invest directly in an index.
Important Tax Information: Reaves Asset Management and its employees are not in the business of providing tax or legal advice to taxpayers. Any such taxpayer should seek advice based on the taxpayer’s own individual circumstances from an independent tax adviser.
Fees: Net performance reflects the deduction of advisory fees which are described in detail in our Form ADV Part 2A.

Please contact your financial professional, or click the following links, for a copy of Reaves’ Form ADV Part 2A and Form CRS.

Additional information about Reaves may be found on our website:  www.reavesam.com.

2021 © Reaves Asset Management (W. H. Reaves & Co., Inc.)


Receive insights about essential service infrastructure